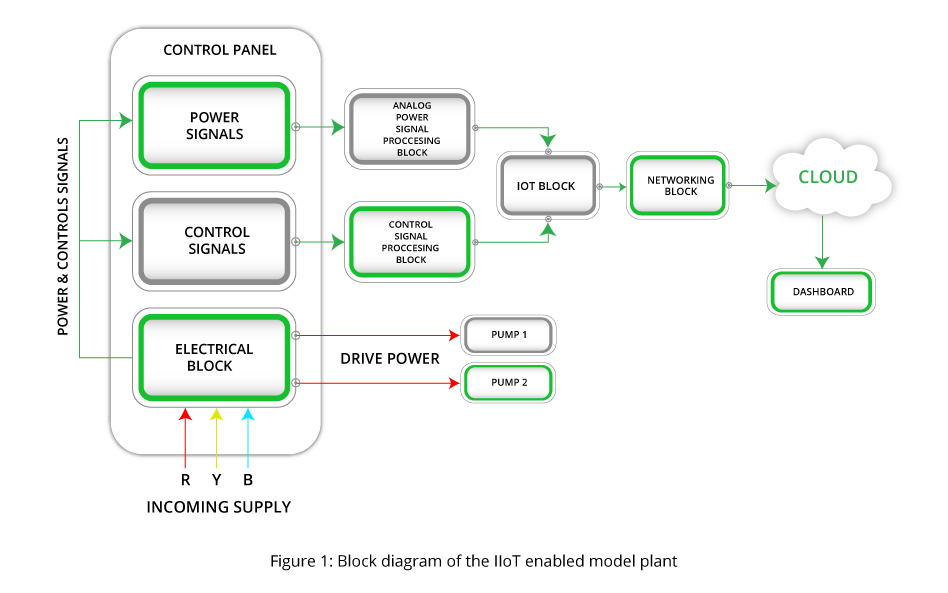
The block diagram in Figure 1 consists of an electrical block which provides electric power and electrical protection and switching circuits for the pumps. This electrical block takes care of the regular plant operation. From this block two sets of signals are obtained-
a. Power consumption and power factor and
b. Control/status signals
The signals sent to respective signal processing blocks. The power signals are processed by analog processing block and the control signals by a digital signal processing block. The analog and digital data are then combined in the IoT block and uploaded to the cloud via the networking block. The dashboard described here displays the data received from the cloud.
a. Analog – The following analog data is available: Power consumption in each phase of a given motor and the corresponding power factor.
b. Digital- The digital signals in binary form indicate the status of the safety controls as well as which motor mode is selected. In the auto mode, the timer ON/OFF status is also read. The pump ON/OFF status is also displayed. Thus, altogether, eight control/status signals are displayed in binary fashion. The complete list of all available signals is provided in a later section.
The dashboard is available for remote viewing. As already explained, the dashboard has distinct sections for the analog data and digital data. A snapshot of the dashboard in operation is provided in Figure 2. It may be divided into several sections which are explained in Figure 3.
Here the various sections of the dashboard are marked off by red boxes. They are then labeled alphabetically as A, B, C D and E respectively.
The various sections are explained below.